Electrocardiography Visualization and Classification
Background
Electrocardiography is the process of producing an electrocardiogram (ECG), which records electrical signals in the heart. The signals are displayed in a graph of voltage as a function of time. Traditionally, ECGs are viewed in a 1D format, which can show around a minute’s worth of data on one screen. However, cardiologists need data ranging from 30 minutes to 8 hours for diagnostic purposes, requiring them to go through multiple ECG graphs and put them together, which can be quite a cumbersome process. To solve this problem, Dr. Matt Yedlin (PI), proposed the creation of a data-driven ECG diagnostic tool using machine learning for cardiologists. The ECG project team at EML was formed and started developing the project in early 2020.
Objective
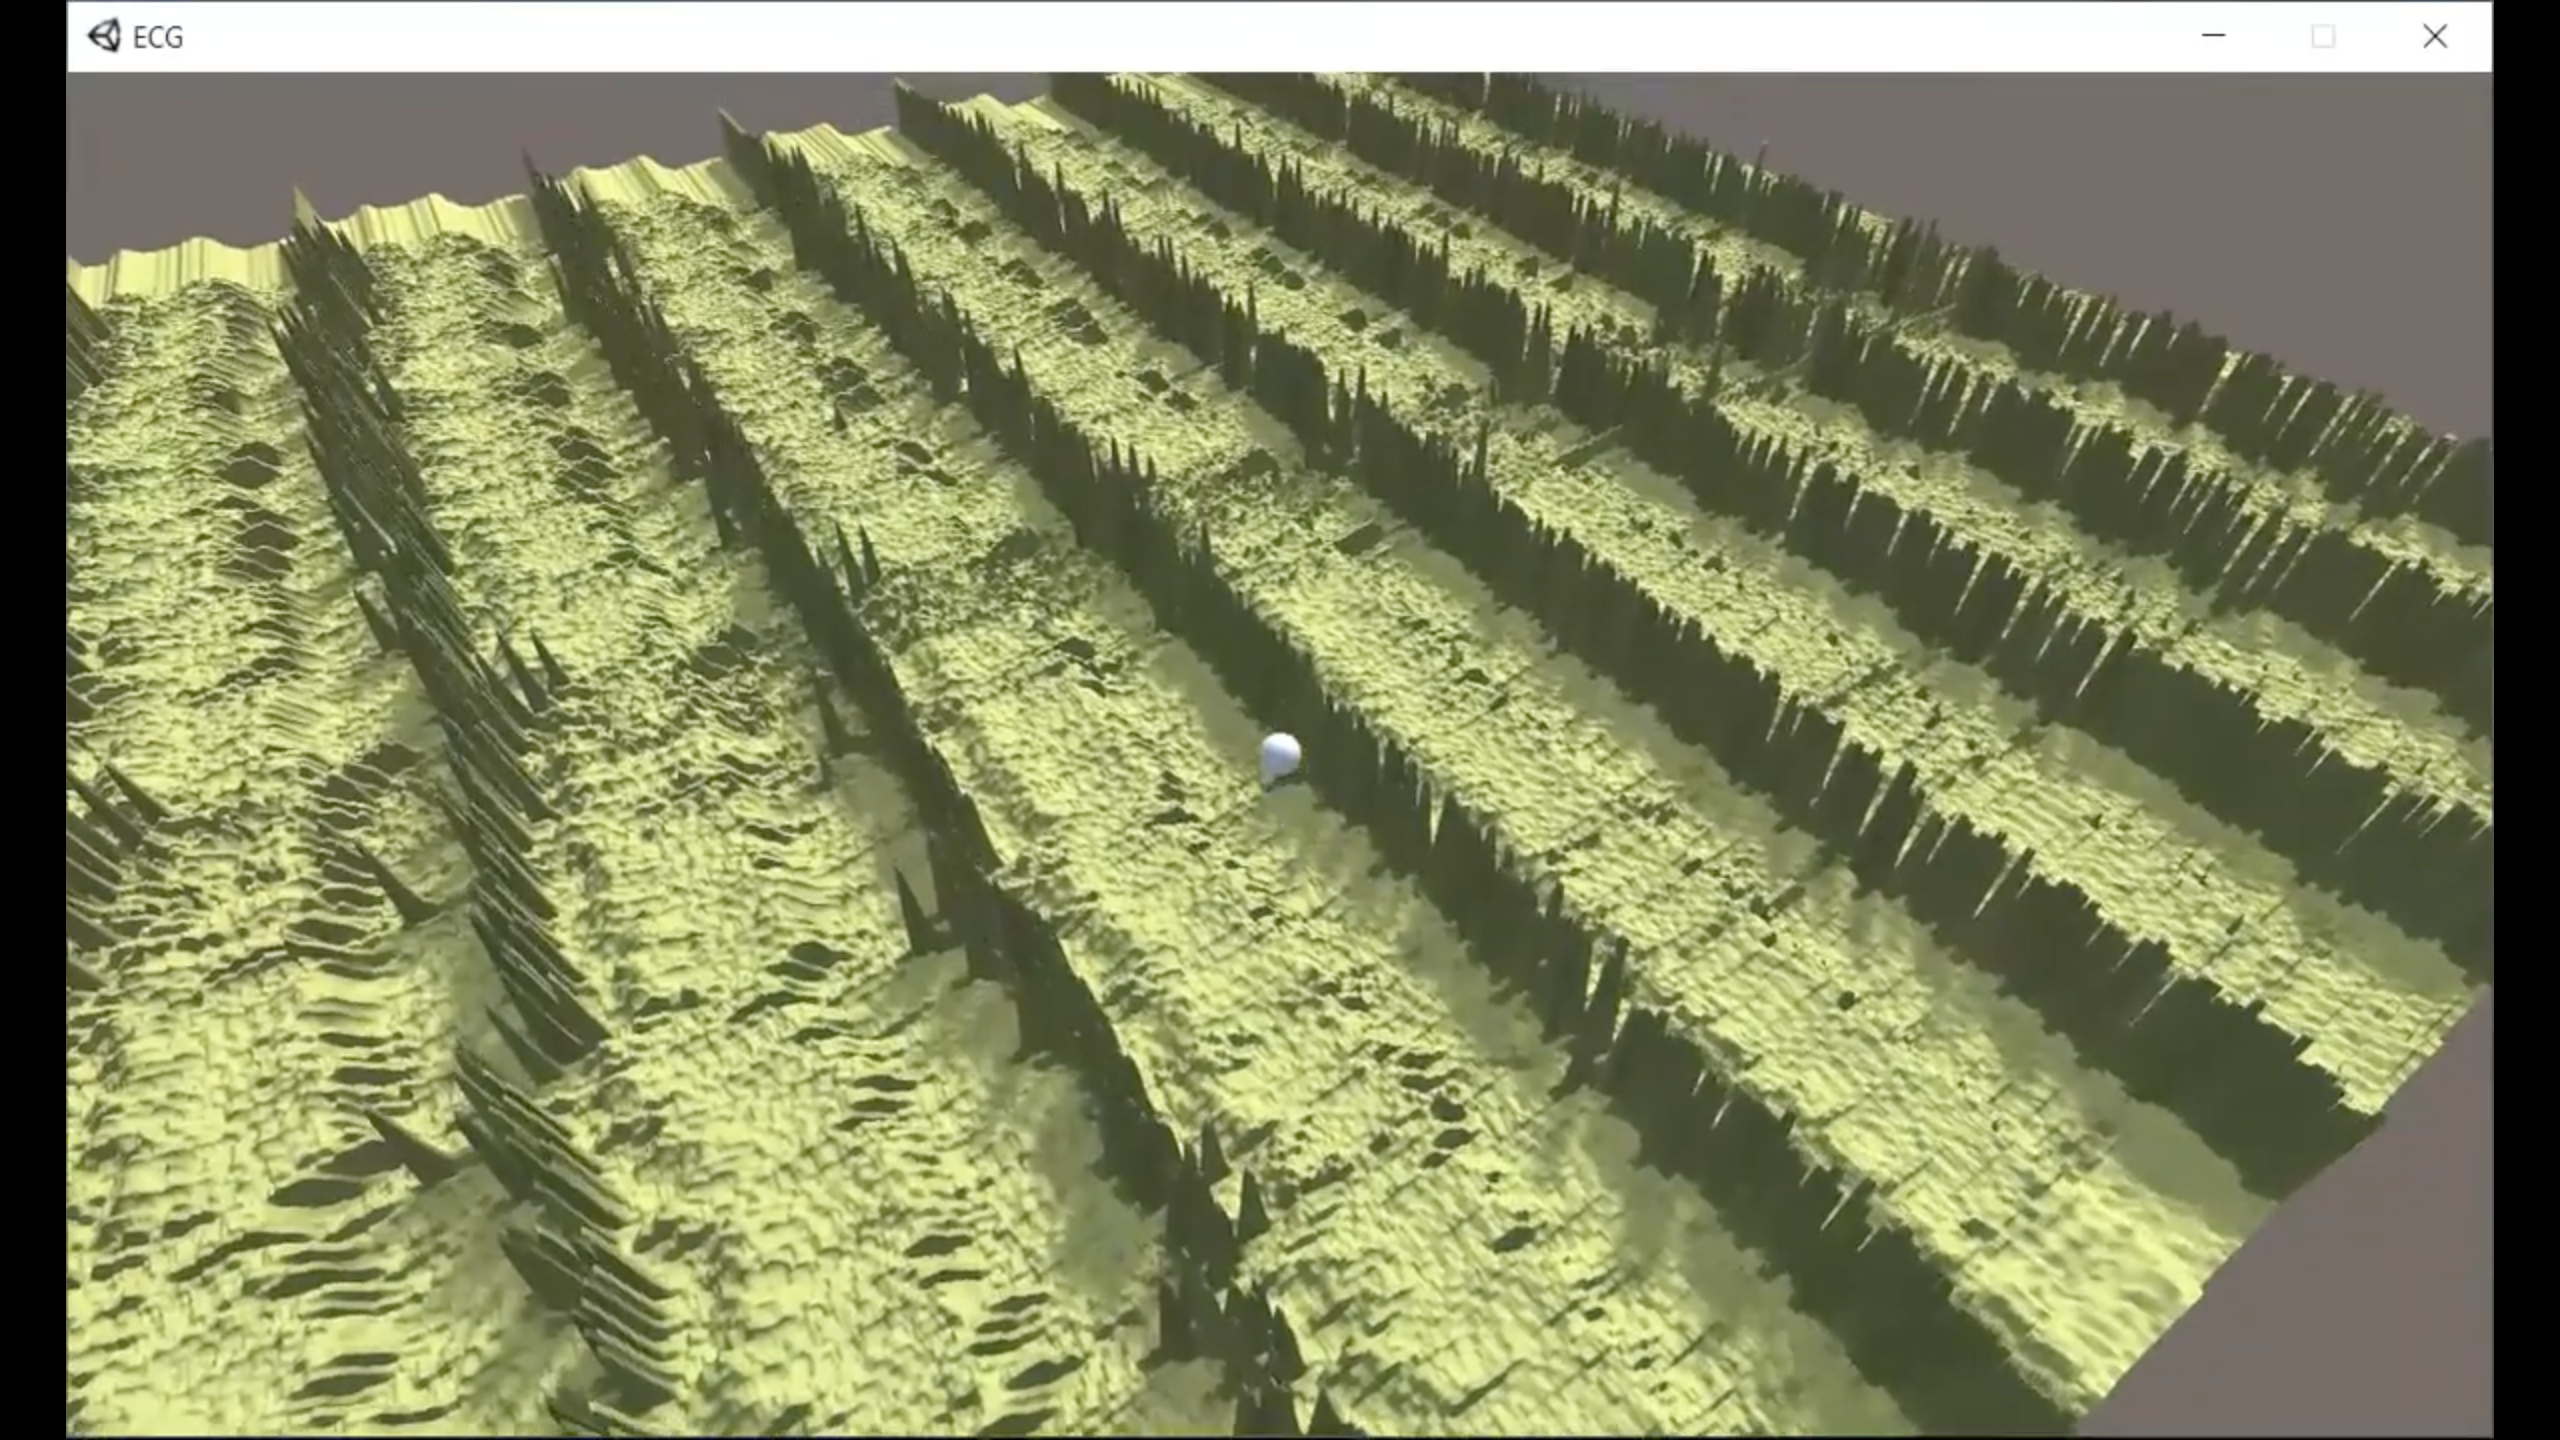
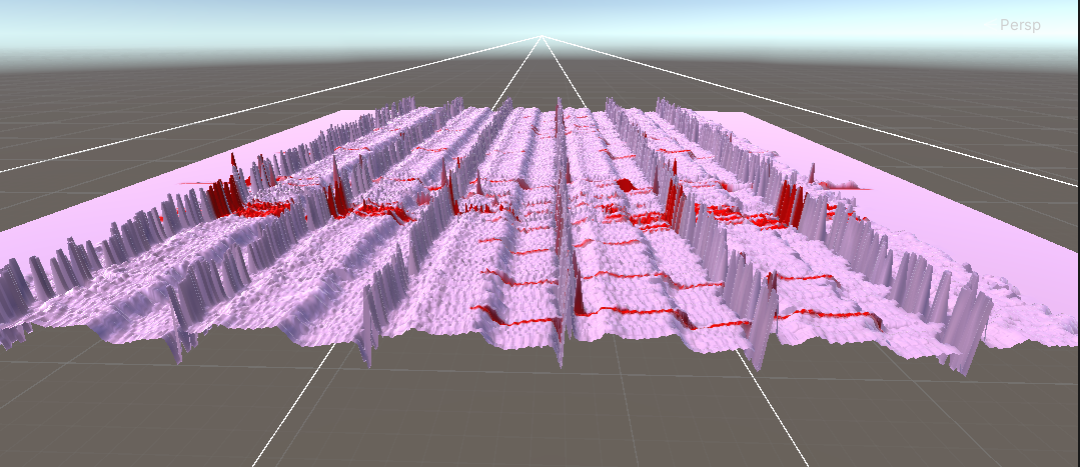
This summer, the team is working on creating a generative adversarial network (GAN) model, a machine learning model that can generate more datasets similar to actual neonatal intensive care unit data. Due to medical confidentiality, the amount of neonatal intensive care unit data was limited, which is why the team needed to expand the training data size using machine learning models by augmenting a sample of actual ECG data to create realistic artificial ECG data for deep neural network training and to improve training accuracy. The team developed a 3D ECG visualization that is able to display several hours’ worth of data at the same time. They acquired electrocardiograms, performed signal processing to reduce/eliminate noise, and then created 3D images of ECG records in Unity.
Format
All the data processing was done using MATLAB and Python. Other software that the team is using includes AWS SageMaker for creating machine-learning models in the cloud and AWS S3 buckets for storing confidential medical neonatal intensive care unit data.
Features
Because the visualization uses the Unity 3D engine, the team was also able to easily port the application to Microsoft HoloLens, the augmented reality smart glasses. With the HoloLens, people can simply wear a headset and navigate the data by rotating their heads, which not only offers a different perspective for viewing data but also offers more agility and a more immersive diagnostic experience. Users can also use VR controllers to navigate through the ECG data. Beyond ECG visualizations, the framework that the project team has developed can also be used for other time-series analyses.
The Team
Principal Investigator(s)
- PI: Dr. Matthew Yedlin, EECE
- PI: Dr. Liisa Holsti, The Department of Occupational Science and Occupational Therapy
Students
- Jinil Patel, Developer
Staff Developer
- Dante Cerron, Project Lead
- George Gu, Developer
Gallery